 taskMap
Leasing and maintenance, on one map.
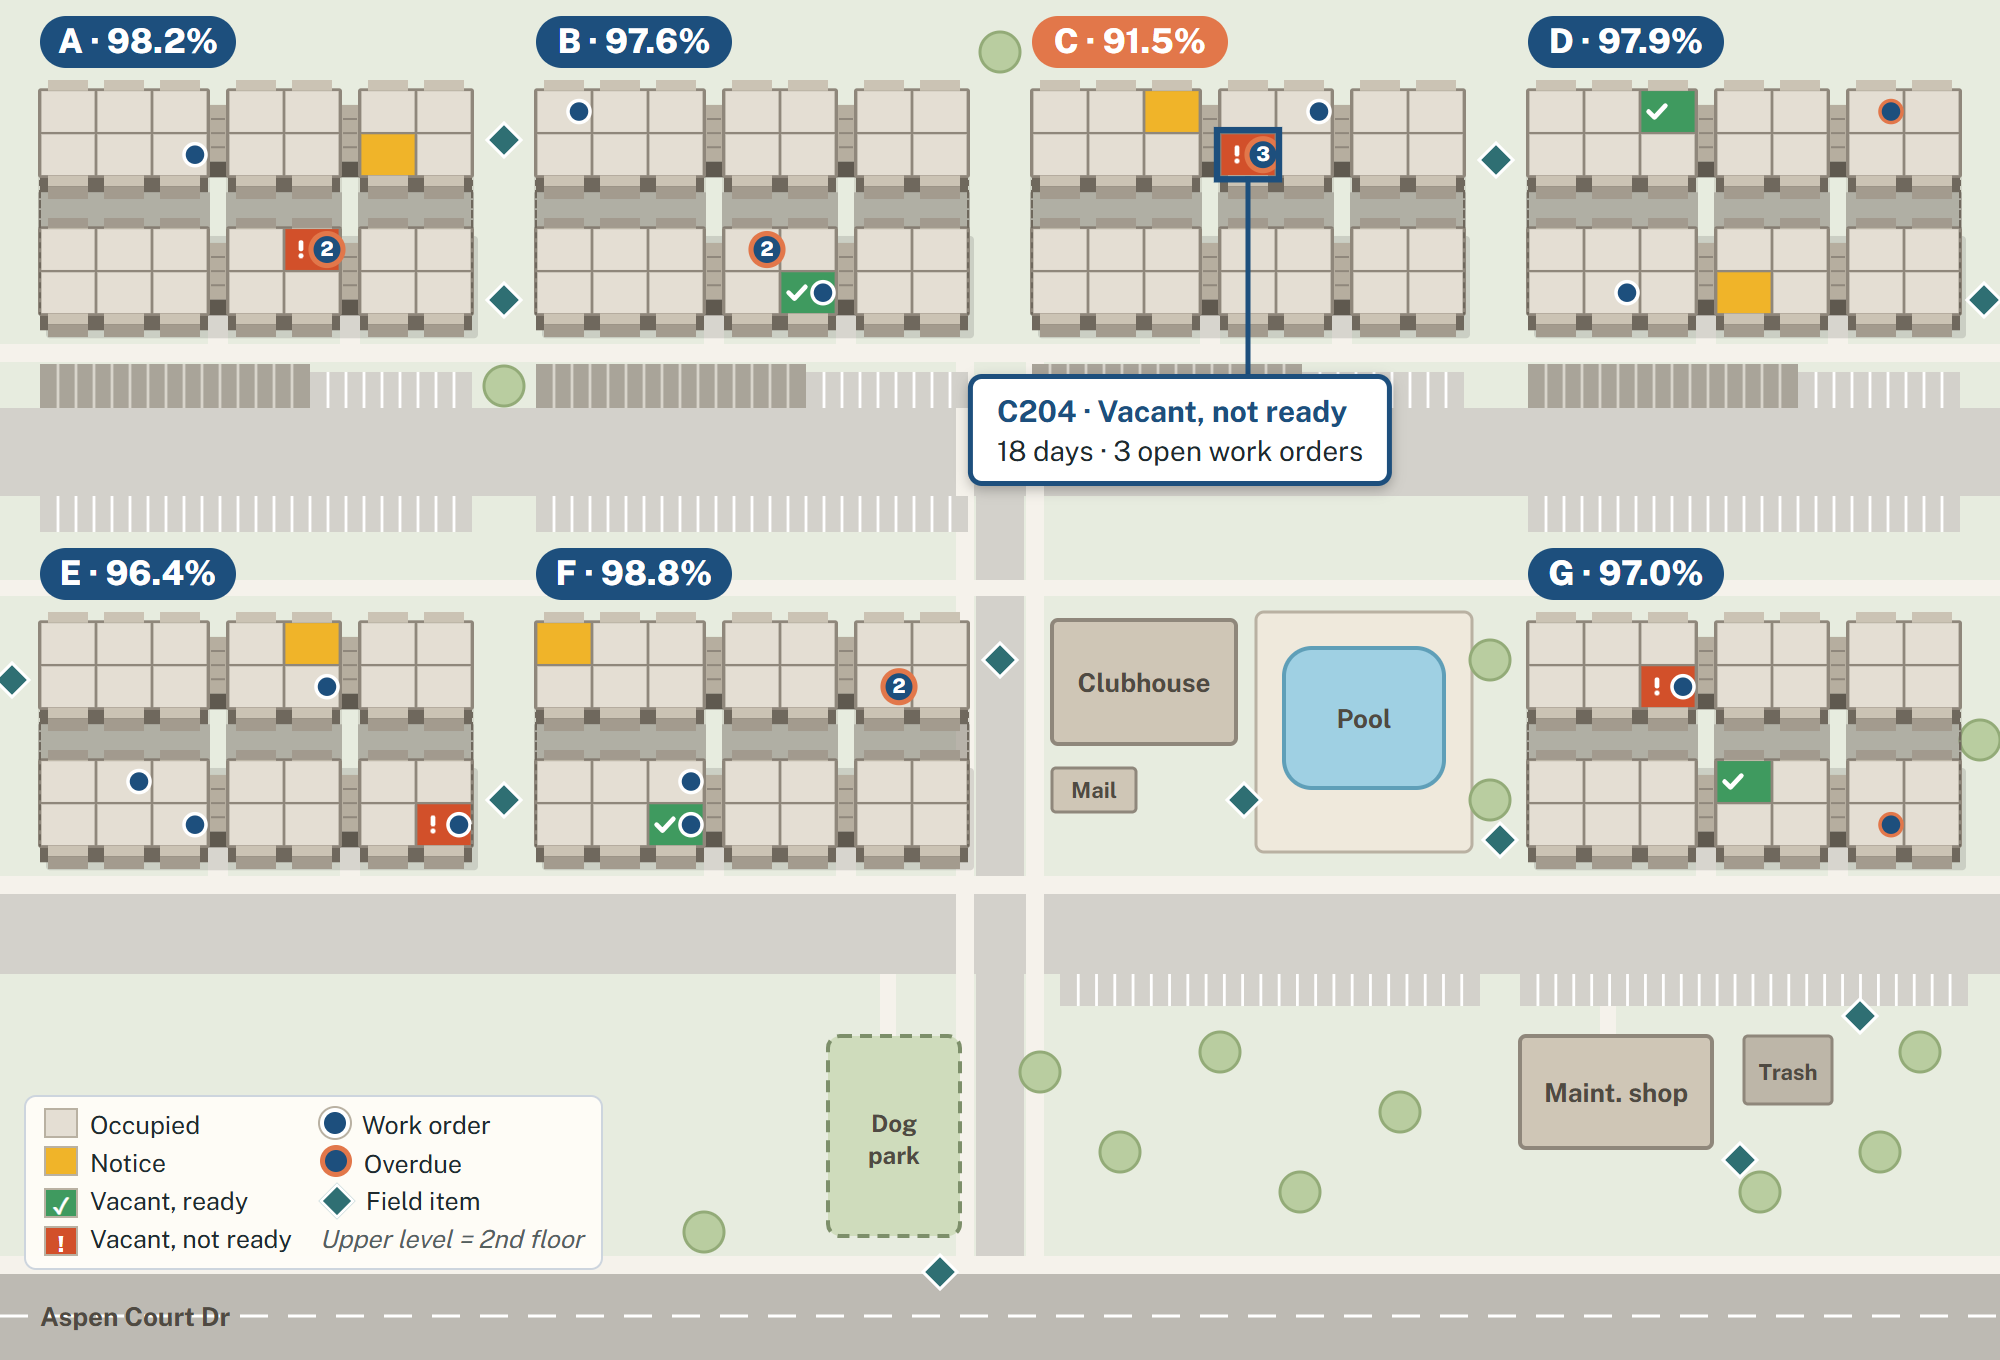
Yardi, Entrata and MRI already track occupancy, collections, work orders and budget, in separate reports. taskMap puts them on one map of every community, building and unit, so a vacant unit with three open work orders stands out before it costs another week of rent. Filters, colors and views are built around how each team works.
Sample data.
 1
2
3
4
R&M · $86.4k of $80k
- Make-ready at a glanceEvery vacant unit, colored by status and days vacant, with its open work orders. The units costing rent stand out.
- Collections by buildingCollection rate shaded by building, from your aged receivables report, so a slipping building shows before month-end.
- Repeat problemsThree water-heater calls in Building E this quarter point to a capital fix, not another patch.
- Budget where the spend isRepairs and maintenance against budget, with the work orders behind the variance pinned on the map.
Status and tasks, for every role
Each unit’s status and its open work sit on the same spot on the map, so the right fix gets done first.
Drill down
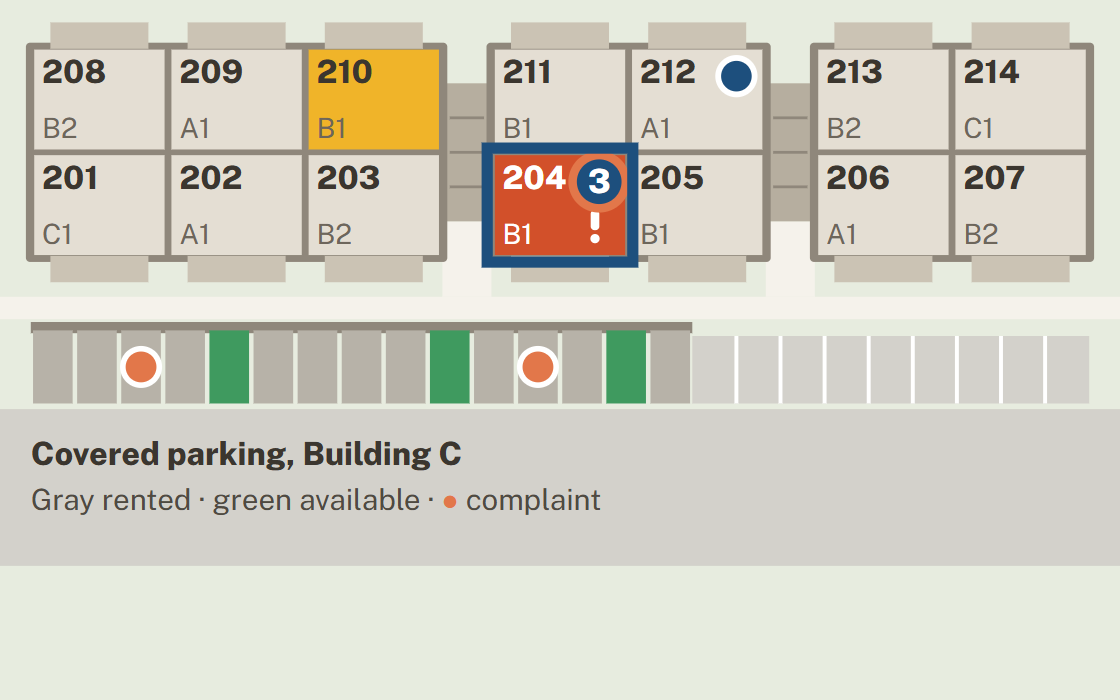
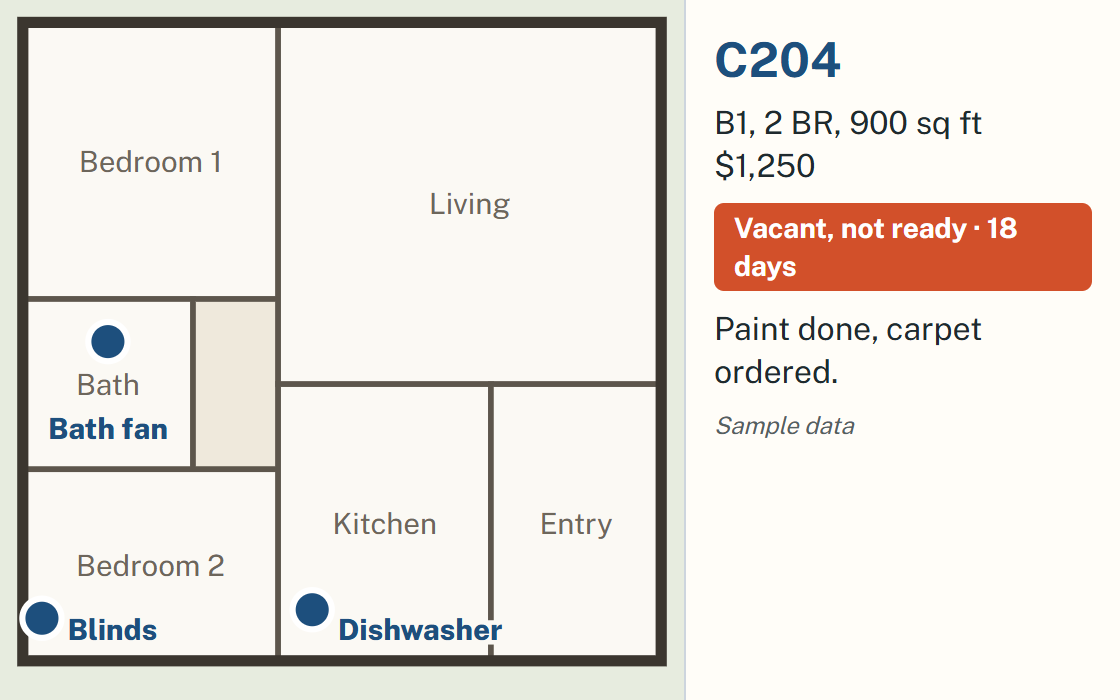
All communities → Aspen Court → Building C, floor 2 → Unit C204. Every task, repair and photo stays with the place it happened.
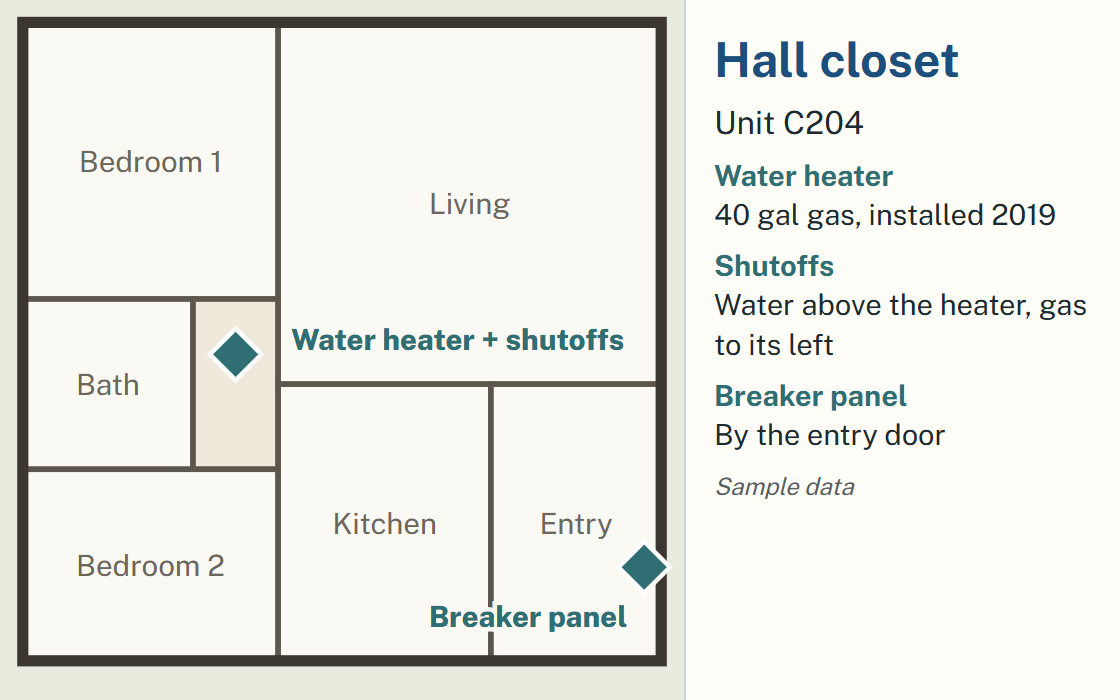
Also in taskMap: photo proof on every closed task · resident reports by QR code from the pool, laundry or mailroom · search any unit, item or shutoff · reports by community, vendor or overdue.
Built from the reports you already run
From Yardi, Entrata or MRI, as Excel or CSV. Your team keeps using the software they have.
- 1Pick the numbers.The measures each team watches.
- 2Share the exports.The reports above, as Excel or CSV.
- 3Your map, built.Inside Power BI if preferred.
- 4It stays current.Refreshed from regular exports.
First order: up to 3 communities, 90 days, setup included. Ask for pricing: launch specials through December 31, 2026.
See taskMap on a sample community.
A 15-minute demo, then a map fitted to how your team works.